Image
We are pleased to announce the publication of our organizational Dashboard for the second quarter of 2017. This Dashboard, which we publish quarterly, presents our achievements in a series of key metrics, such as publishing output, Cochrane Library usage, and progress on meeting Strategy to 2020 targets. Work on Strategy targets is covered in more detail in the Target Report below.
This initiative is part of Cochrane’s commitment to organizational transparency. For everyone interested in Cochrane and our work, these critical indicators provide an opportunity to monitor our production and dissemination of evidence, and our organizational health.
Highlights from the second quarter include:
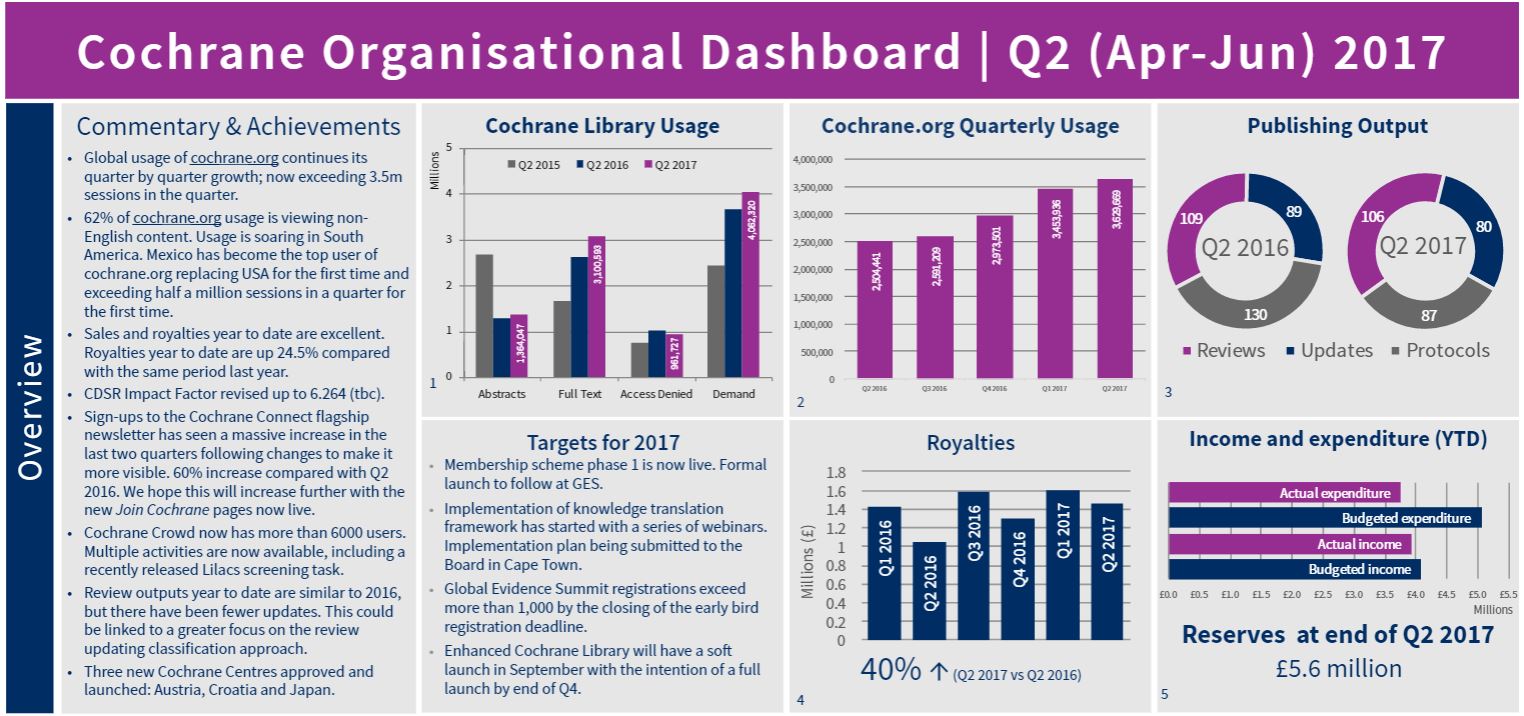
- Global usage of Cochrane.org continues its quarter-by-quarter growth; now exceeding 3.5m sessions in the quarter.
- 62% of Cochrane.org usage is viewing non-English content. Usage is soaring in South America. Mexico has become the top user of Cochrane.org, replacing USA for the first time and exceeding half a million sessions in a quarter for the first time.
- Sales and royalties year to date are excellent. Royalties year to date are up 24.5% compared with the same period last year.
For more information: